1、 Valgrind简介
Valgrind是一个GPL的软件,用于Linux程序的内存调试、内存泄漏检测以及性能分析的软件开发工具。Valgrind工具主要用于C和C++写的程序,因为用这些语言写的程序倾向于有更多的bug,Valgrind已经被部分地或者完全的用于C,C++,Java,Perl,Python,汇编,Fortran,Ada和许多其他语言写的程序。
使用Valgrind的工具包,你可以自动的检测许多内存管理的bug和性能瓶颈。Valgrind可以和其他工具一起使用。Valgrind可以绑定GDB并附加到程序检测出错误的地方,因此你可以执行并且指出当前运行到什么地方了。
2、 安装valgrind
1)下载:
到www.valgrind.org 下载最新版valgrind-3.8.1.tar.bz2下载到本地
2)解压:
用rz -be命令上传到服务器
解压安装包:tar –jxvf valgrind-3.8.1.tar.bz2
解压后生成目录valgrind-3.8.1
3)安装:
标准gnu软件安装方式,./configure — make — make install
cd valgrind-3.8.1
./configure
make;
make install
3、 Valgrind工具主要功能
Valgrind包括如下一些工具:
1) Memcheck。这是valgrind应用最广泛的工具,一个重量级的内存检查器,能够发现开发中绝大多数内存错误使用情况,比如:使用未初始化的内存,使用已经释放了的内存,内存访问越界等。这也是本文将重点介绍的部分。
2) Callgrind。它主要用来检查程序中函数调用过程中出现的问题。
3) Cachegrind。它主要用来检查程序中缓存使用出现的问题。
4) Helgrind。它主要用来检查多线程程序中出现的竞争问题。
5) Massif。它主要用来检查程序中堆栈使用中出现的问题。
6) Extension。可以利用core提供的功能,自己编写特定的内存调试工具。
下面分别介绍各个工具的作用:
3.1. Memcheck
Memcheck是最常用的工具,用来检测程序中出现的内存问题,所有对内存的读写都会被检测到,一切对malloc()/free()/new/delete的调用都会被捕获。所以,它能检测以下问题:
1) 对未初始化内存的使用;
2) 读/写释放后的内存块;
3) 读/写超出malloc分配的内存块;
4) 读/写不适当的栈中内存块;
5) 内存泄漏,指向一块内存的指针永远丢失;
6) 不正确的malloc/free或new/delete匹配;
7) memcpy()相关函数中的dst和src指针重叠
这些问题往往是C/C++程序员最头疼的问题,Memcheck在这里帮上了大忙。
3.2. Helgrind
Helgrind用于检测多线程竞争资源的工具。
它主要用来检查多线程程序中出现的竞争问题。Helgrind 寻找内存中被多个线程访问,而又没有一贯加锁的区域,这些区域往往是线程之间失去同步的地方,而且会导致难以发掘的错误。Helgrind实现了名为“Eraser”的竞争检测算法,并做了进一步改进,减少了报告错误的次数。不过,Helgrind仍然处于实验阶段。
3.3. Callgrind
Callgrind收集程序运行时的一些数据,建立函数调用关系等信息,还可以有选择地进行cache 模拟。在运行结束时,它会把分析数据写入一个文件。callgrind_annotate可以把这个文件的内容转化成可读的形式。
3.4. Cachegrind
Cachegrind用于检查缓存使用的工具。
它模拟 CPU中的一级缓存I1,D1和L2二级缓存,能够精确地指出程序中 cache的丢失和命中。如果需要,它还能够为我们提供cache丢失次数,内存引用次数,以及每行代码,每个函数,每个模块,整个程序产生的指令数。这对优化程序有很大的帮助。Cache对目前系统的性能有决定性的影响。因此这些信息可以指导程序员调整代码,最大限度的提高程序性能。
3.5. Massif
Massif堆栈分析器,它能测量程序在堆栈中使用了多少内存,告诉我们堆块,堆管理块和栈的大小。Massif能帮助我们减少内存的使用,在带有虚拟内存的现代系统中,它还能够加速我们程序的运行,减少程序停留在交换区中的几率。
程序开发者通过它可以深入了解程序的内存使用行为,从而对内存使用进行优化。这个功能对C++尤其有用(因为C++有很多隐藏的内存分配和释放)。
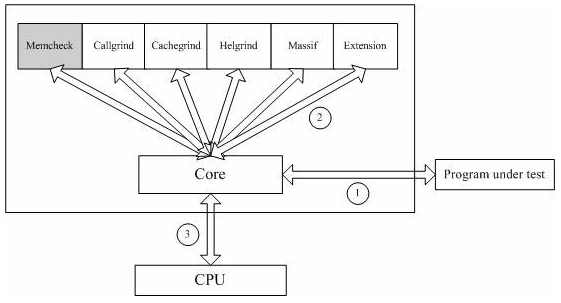
4、 Valgrind体系结构
Valgrind是一套Linux下,开放源代码(GPL V2)的仿真调试工具的集合。Valgrind由内核(core)以及基于内核的其他调试工具组成。内核类似于一个框架(framework),它模拟了一个CPU环境,并提供服务给其他工具;而其他工具则类似于插件(plug-in),利用内核提供的服务完成各种特定的内存调试任务。
Valgrind的体系结构如下图所示:
5、Linux程序内存空间布局
要发现Linux下的内存问题,首先一定要知道在Linux下,内存是如何被分配的?下图展示了一个典型的Linux C程序内存空间布局:
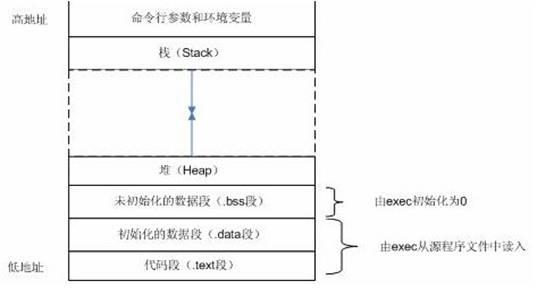
一个典型的Linux C程序内存空间由如下几部分组成:
1) 代码段(.text)。这里存放的是CPU要执行的指令。代码段是可共享的,相同的代码在内存中只会有一个拷贝,同时这个段是只读的,防止程序由于错误而修改自身的指令。
2) 初始化数据段(.data)。这里存放的是程序中需要明确赋初始值的变量,例如位于所有函数之外的全局变量:int val=100。需要强调的是,以上两段都是位于程序的可执行文件中,内核在调用exec函数启动该程序时从源程序文件中读入。
3) 未初始化数据段(.bss)。位于这一段中的数据,内核在执行该程序前,将其初始化为0或者null。例如出现在任何函数之外的全局变量:int sum;
4) 堆(Heap)。这个段用于在程序中进行动态内存申请,例如经常用到的malloc,new系列函数就是从这个段中申请内存。
5) 栈(Stack)。函数中的局部变量以及在函数调用过程中产生的临时变量都保存在此段中。
6、内存检查原理

Memcheck 能够检测出内存问题,关键在于其建立了两个全局表。
1) Valid----Value表:
对于进程的整个地址空间中的每一个字节(byte),都有与之对应的8个bits;对于 CPU 的每个寄存器,也有一个与之对应的bit向量。这些bits负责记录该字节或者寄存器值是否具有有效的、已初始化的值。
2) Valid----Address表:
对于进程整个地址空间中的每一个字节(byte),还有与之对应的1个bit,负责记录该地址是否能够被读写。
检测原理
1) 当要读写内存中某个字节时,首先检查这个字节对应的 A bit。如果该A bit显示该位置是无效位置,memcheck 则报告读写错误。
2) 内核(core)类似于一个虚拟的 CPU 环境,这样当内存中的某个字节被加载到真实的 CPU 中时,该字节对应的 V bit 也被加载到虚拟的 CPU 环境中。一旦寄存器中的值,被用来产生内存地址,或者该值能够影响程序输出,则 memcheck 会检查对应的V bits,如果该值尚未初始化,则会报告使用未初始化内存错误。
7、 Valgrind 使用
7.1. 编译程序
为了使valgrind发现的错误更精确,如能够定位到源代码行,建议在编译时加上-g参数,-o sample,确定输出文件的名称为sample。
一般c程序就用gcc编译,c++程序就用g++编译,这里用到的示例程序文件名为:sample.c,选用的编译器为gcc,生成可执行程序:
gcc -g sample.c -o sample
7.2. 参数用法
valgrind [options] prog-and-args [options]: 常用选项,适用于所有Valgrind工具。
1. -tool=<toolname> [default:memcheck]。运行 valgrind中名为toolname的工具,例如,Memcheck,Cachegrind等等。如果省略工具名,默认运行memcheck。
2. -h --help 显示所有选项的帮助,包括内核和选定的工具两者。
3. --help-debug 和—help相同,并且还能显示通常只有Valgrind的开发人员使用的调试选项。
4. --version 显示valgrind内核的版本号,工具可以有他们自己的版本号。这是一种保证工具只在它们可以运行的内核上工作的一种设置。这样可以减少在工具和内核之间版本兼容性导致奇怪问题的概率。
5. q –quiet 安静地运行,只打印错误信息。在进行回归测试或者有其它的自动化测试机制时会非常有用。
6. v –verbose 更详细的信息。在各个方面显示你的程序的额外信息,例如:共享对象加载,使用的充值,执行引擎和工具的进程,异常行为的警告信息。重复这个标记可以增加详细的级别。
7. -d 调试Valgrind自身发出的信息。通常只有Valgrind开发人员对此感兴趣。重复这个标记可以产生更详细的输出。
8. --trace-children=<no|yes>[default:no] 当这个选项打开时,Valgrind会跟踪到子进程中。这经常会导致困惑,而且通常不是你所期望的,所以默认这个选项是关闭的。
9. --leak-check=<no|summary|yes|full> [default: summary] 当客户程序结束后,对内存泄露进行检查。内存泄露是指一个分配的块没有被释放,但是没有指针再指向它。如果设置成summary,它只告诉内存如何泄露了。如果设置成full或者yes,它将报告每个泄露的详细信息。
10. --show-reachable=<yes|no> [default: no] 当disabled时,内存泄露检测只显示那些没有指针指向的块或只能找到一个指向其中间位置的指针的块。内存泄露的主要发生在这些块上。当enabled时,泄露检测也会报告那些能找到一个指针指向的块。你的程序至少在理论上在退出前能释放这些块。与没有指针指向的块或那些只有一个内部指针指向的块相比: 它们(可能指没有指针指向的块或那些只有一个内部指针指向的块)更有可能会内存泄漏,因为你事实上没有一个指向块的起始位置的指针,即使你想释放,也没有进行释放的指针。
11. --track-origins=<yes|no> [default: no]是否跟踪未初始化的值来自哪里。默认是关闭的,这就意味着它虽然能告诉你使用一种危险的方式访问未初始化的变量,但是不能告诉你未初始化的变量来自哪里。当设置成yes,memcheck将会努力将未初始化的变量的位置告诉你。可能来自以下四个位置:heap bloack, 栈中分配的,客户端请求的(?),或者其他方式(如调用brk等)
12. --leak-resolution=<low|med|high>:这个选项设定内存检查工具在检测出多个内存泄露时,如何将这些内存泄露归结为同一个泄露(合并那些由相同原因引起的)。设为low时,试图合并前两个泄露情况,设为med,则是前四个,默认是high,试图合并所有的泄露情况。这个选项不影响memcheck找泄露的能力,只是影响它的检测结果显示。
13. --track-fds=<no|yes>[default:no] 当这个选项打开时,Valgrind会在退出时打印一个打开文件描述符的列表。每个文件描述符都会打印出一个文件是在哪里打开的栈回溯,和任何与文件描述符相关的详细信息比如文件名或socket信息。
14. --time-stamp=<no|yes>[default:no] 当这个选项打开时,每条信息之前都有一个从程序开始消逝的时间,用天,小时,分钟,秒和毫秒表示。
15. --log-fd=<number>[default:2=stderr] 指定Valgrind把它所有的消息都输出到一个指定的文件描述符中去。默认值2,是标准错误输出(stderr)。注意这可能会干扰到客户端自身对stderr的使用,Valgrind的输出与客户程序的输出将穿插在一起输出到stderr。
16. --log-file=<filename> 指定Valgrind把它所有的信息输出到指定的文件中。
17. --log-file-exactly=< filename> 类似于--log-file,输出LOG信息到file。
18. --log-file-qualifier=<VAR> 当和—log-file一起使用时,日志文件名将通过环境变量$VAR来筛选,这对于MPI程序是有益的。
19. --log-socket=<ip-address:port-number> 指定Valgrind输出所有的消息到指定的IP,指定的端口。当使用1500端口时,端口有可能被忽略。如果不能建立一个到指定端口的连接,Valgrind将输出写到标准错误(stderr)。这个选项经常和一个Valgrind监听程序一起使用。
7.3. LOG信息输出
这些选项适用于所有产生错误的工具,比如Memcheck,但是Cachegrind不行。
1. --xml=<no|yes>[default:no] 当这个选项打开,输出将是xml格式,只有Memcheck可用。
2. --xml-user-comment=<string> 在XML开头附加用户注释,仅在指定了--xml=yes时生效,否则忽略。
3. --num-callers=<number>[default:12] 默认情况下,Valgrind显示12层函数调用的函数名有助于确定程序的位置。可以通过这个选项来改变这个数字。这样有助在嵌套调用的层次很深时确定程序的位置。注意错误信息通常只回溯到最顶上的4个函数。(当前函数,和它的3个调用者的位置)。所以这并不影响报告的错误总数。最大值是50。注意高的设置会使Valgrind运行得慢,并且使用更多的内存,但是在嵌套调用层次比较高的程序中非常实用。
4. --error-limit=<no|yes>[default:yes] 如果太多错误,则停止显示新错误
5. --error-exitcode=<number>[default:0] 指定如果Valgrind在运行过程中报告任何错误时的退出返回值,有两种情况:当设置为默认值(零)时,Valgrind返回的值将是它模拟运行的程序的返回值。当设置为非零值时,如果Valgrind发现任何错误时则返回这个值。
6. --show-below-main=<no|yes>[default:no] 默认地,错误时的栈回溯不显示main()之下的任何函数。
7. --suppressions=<filename>[default:$PREFIX/lib/valgrind/default.supp] 指定一个额外的文件读取不需要理会的错误;你可以根据需要使用任意多的额外文件。
8. --gen-suppressions=<yes|no|all>[default:no] 当设置为yes时,Valgrind将会在每个错误显示之后自动暂停并且打印这一行:----Print suppression?---[Return/N/n/Y/y/C/c]---- 当设置为all时,Valgrind会对每一个错误打印一条禁止条目,而不向用户询问。这个提示的行为和--db-attach选项(见下面)相同。这个选项对C++程序非常有用,它打印出编译器调整过的名字。
9. --db-attach=<no|yes>[default:no] 当这个选项打开时,Valgrind将会在每次打印错误时暂停并打出一行:---- Attach to debugger ? --- [Return/N/n/Y/y/C/c] ----按下回车,或者N、回车,n、回车,Valgrind不会对这个错误启动调试器。按下Y、回车,或者y、回车,Valgrind会启动调试器并设定在程序运行的这个点。当调试结束时,退出,程序会继续运行。在调试器内部尝试继续运行程序,将不会生效。按下C、回车,或者c、回车,Valgrind不会启动一个调试器,并且不会再次询问。
10. --db-command=<command>[default:gdb –nw%f%p] 通过--db-attach指定如何使用调试器。默认的调试器是gdb.%f会用可执行文件的文件名替换,%p会被可执行文件的进程ID替换。
11. --input-fd=<number>[default:0,stdin] 使用--db-attach=yes和--gen-suppressions=yes选项,在发现错误时,Valgrind会停下来去读取键盘输入。默认地,从标准输入读取,所以关闭了标准输入的程序会有问题。这个选项允许你指定一个文件描述符来替代标准输入读取。
12. --max-stackframe=<number> [default:2000000] 栈的最大值。如果栈指针的偏移超过这个数量,Valgrind则会认为程序是切换到了另外一个栈执行。
7.4. 适用于Memcheck工具的相关选项
1. --log-file=valgrind_log 检测报告存入valgrind_log中
2. --leak-check=full 指的是完全检查内存泄露
3. --show-reachable=yes 是显示内存泄露的地点
4. --trace-children=yes 是跟入子进程
5. -NT 不输出时间统计信息
6. -cache N 指定cache的大小,取值范围[0,131072]
7. -X 启动单进程模式,即不会产生任何子进程
8. --leak-resolution=<low|med|high>设定内存检查工具在检测出多个内存泄露时,如何将这些内存泄露归结为同一个泄露(合并由相同原因引起的)。
7.5. Valgrind可以识别的错误及错误提示
1. malloc/free 内存在退出前没有被释放
2. Invalid write of size 非法写内存,一般为数组越界
3. Invalid read of size 非法读内存,一般为数组越界
4. definitely lost/possibly lost/still reachable in loss record 内存未释放
5. Invalid free()/delete/delete[] 同一指针被多次释放
6. Source and destination overlap 内存重叠(一般是使strncpy,memcpy引起)
7. Syscall param contains uninitialised byte 调用系统函数时传入了未初始化的变量
8. Conditional jump or move depends on uninitialised value 条件判断时使用了未初始化的变量
9. Access not within mapped region/Stack overflow 栈溢出
10. Mismatched free()/delete/delete[] new--delete malloc--free搭配错误
7.6. 阅读valgrind给出的内存泄露报告
“LEAK SUMMARY”:这表示下面是内存泄露的信息(造成内存丢失的程序行可以通过查看这一行前面的清单来定位)。
1) still reachable: 表示泄漏的内存在程序运行完的时候,仍旧有指针指向它,因而,这种内存在程序运行结束之前可以释放。一般情况下valgrind不会报这种泄漏,除非使用了参数 --show-reachable=yes。指的是内存指针还在 还有机会使用或者释放。如果你后面的程序不用或者不释放也会泄漏,valgrind在当时还不知道以后会不会泄漏 。
2) definitely lost: 明确地已经泄漏了,因为在程序运行完的时候,没有指针指向它, 指向它的指针在程序中丢失了。一般这种泄漏常见,而且比较难发现问题所在。
3) indirectly lost: 间接地,指向该内存的指针都位于内存泄露处。
4) possibly lost: 发现了一个指向某块内存中部的指针,而不是指向内存块头部。这种指针一般是原先指向内存块头部,后来移动到了内存块的中部,还有可能该指针和该内存根本就没有关系,检测工具只是怀疑有内存泄漏。
8、 Memcheck使用举例
8.1. 使用未初始化的内存
对于位于程序中不同段的变量,其初始值是不同的,全局变量和静态变量初始值为0,而局部变量和动态申请的变量,其初始值为随机值。如果程序使用了为随机值的变量,那么程序的行为就变得不可预期。
Memcheck检测内存问题的原理如下图所示:
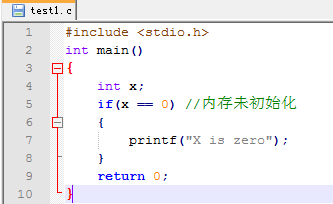
Valgrind可以知道如果一个变量被赋予一个未初始化的变量,这个变量仍然处于"未初始化"状态。
Ø 编译程序test.c
gcc编译C程序文件:gcc test1.c -g -o test1
使用valgrind前需要使用-g参数编译源程序以便生成debug信息。
Ø 使用Valgrind检查
valgrind --tool=memcheck --leak-check=full ./test1
为了能够给出内存检测报告,需要加上--leak-check参数
其中--leak-check=full 指的是完全检查内存泄漏。
Ø 分析输出的调试信息
==12120== Memcheck, a memory error detector
==12120== Copyright (C) 2002-2012, and GNU GPL'd, by Julian Seward et al.
==12120== Using Valgrind-3.8.1 and LibVEX; rerun with -h for copyright info
==12120== Command: ./test1
==12120==
/*错误:使用未初始化的变量,位置:test1.c的第5行*/
==12120== Conditional jump or move depends on uninitialised value(s)
==12120== at 0x400504: main (test1.c:5)
==12120==
X is zero==12120==
==12120== HEAP SUMMARY:
==12120== in use at exit: 0 bytes in 0 blocks
==12120== total heap usage: 0 allocs, 0 frees, 0 bytes allocated
==12120==
==12120== All heap blocks were freed -- no leaks are possible
==12120==
==12120== For counts of detected and suppressed errors, rerun with: -v
==12120== Use --track-origins=yes to see where uninitialised values come from
==12120== ERROR SUMMARY: 1 errors from 1 contexts (suppressed: 2 from 2)
从这份报告可以看出进程PID是12120,
错误:test1.c文件的第5行main函数使用了一个未初始化的变量:
/*使用了未初始化的变量(包括未初始化的局部变量和未初始化的堆区域)*/Conditional jump or move depends on uninitialised value(s)
8.2. 非法写/读错误,使用超过分配的内存空间
这种情况是指:访问了你不应该/没有权限访问的内存地址空间,比如访问数组时越界;对动态内存访问时超出了申请的内存大小范围。

Ø 使用Valgrind检查
valgrind --tool=memcheck --leak-check=full ./test3
Ø 分析输出的调试信息
==4381== Memcheck, a memory error detector
==4381== Copyright (C) 2002-2012, and GNU GPL'd, by Julian Seward et al.
==4381== Using Valgrind-3.8.1 and LibVEX; rerun with -h for copyright info
==4381== Command: ./test3
==4381==
/*错误一:第9行iw[i]数组越界,非法的4字节写操作*/
==4381== Invalid write of size 4
==4381== at 0x400638: main (test3.c:9)
==4381== Address 0x51c8068 is 0 bytes after a block of size 40 alloc'd
==4381== at 0x4A21958: malloc (vg_replace_malloc.c:270)
==4381== by 0x400609: main (test3.c:5)
==4381==
/*错误二:第12行iw[i]数组越界,非法的4字节读操作*/
==4381== Invalid read of size 4
==4381== at 0x40066A: main (test3.c:12)
==4381== Address 0x51c8068 is 0 bytes after a block of size 40 alloc'd
==4381== at 0x4A21958: malloc (vg_replace_malloc.c:270)
==4381== by 0x400609: main (test3.c:5)
==4381==
/*错误三:第12行ir[i]数组越界,非法的4字节写操作*/
==4381== Invalid write of size 4
==4381== at 0x40066C: main (test3.c:12)
==4381== Address 0x51c80d8 is 0 bytes after a block of size 40 alloc'd
==4381== at 0x4A21958: malloc (vg_replace_malloc.c:270)
==4381== by 0x400617: main (test3.c:6)
==4381==
==4381==
==4381== HEAP SUMMARY:
==4381== in use at exit: 0 bytes in 0 blocks
==4381== total heap usage: 2 allocs, 2 frees, 80 bytes allocated
==4381==
==4381== All heap blocks were freed -- no leaks are possible
==4381==
==4381== For counts of detected and suppressed errors, rerun with: -v
==4381== ERROR SUMMARY: 3 errors from 3 contexts (suppressed: 2 from 2)

Ø 使用Valgrind检查
valgrind --tool=memcheck --leak-check=full ./test6
Ø 分析输出的调试信息
==19597== Memcheck, a memory error detector
==19597== Copyright (C) 2002-2012, and GNU GPL'd, by Julian Seward et al.
==19597== Using Valgrind-3.8.1 and LibVEX; rerun with -h for copyright info
==19597== Command: ./test6
==19597==
/*错误:数组越界,位置:第5行*/
==19597== Invalid write of size 1
==19597== at 0x400566: main (test6.c:5)
==19597== Address 0x4d6804a is 0 bytes after a block of size 10 alloc'd
==19597== at 0x4A21958: malloc (vg_replace_malloc.c:270)
==19597== by 0x400559: main (test6.c:4)
==19597==
==19597==
==19597== HEAP SUMMARY:
==19597== in use at exit: 0 bytes in 0 blocks
==19597== total heap usage: 1 allocs, 1 frees, 10 bytes allocated
==19597==
==19597== All heap blocks were freed -- no leaks are possible
==19597==
==19597== For counts of detected and suppressed errors, rerun with: -v
==19597== ERROR SUMMARY: 1 errors from 1 contexts (suppressed: 2 from 2)
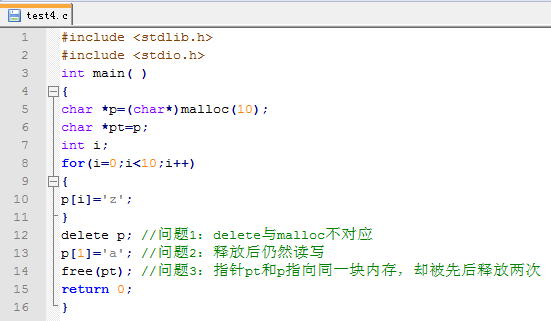
8.3. 使用已经释放的内存
本质上说,系统会在堆上维护一个动态内存链表,如果被释放,就意味着该块内存可以继续被分配给其他部分,如果内存被释放后再访问,就可能覆盖其他部分的信息,这是一种严重的错误。
Ø 使用Valgrind检查
valgrind --tool=memcheck --leak-check=full ./test4
Ø 分析输出的调试信息
==12533== Memcheck, a memory error detector
==12533== Copyright (C) 2002-2012, and GNU GPL'd, by Julian Seward et al.
==12533== Using Valgrind-3.8.1 and LibVEX; rerun with -h for copyright info
==12533== Command: ./test4
==12533==
/*错误一:第5行的malloc申请与第12行的delete释放不对应*/
==12533== Mismatched free() / delete / delete []
==12533== at 0x4A20F40: operator delete(void*) (vg_replace_malloc.c:480)
==12533== by 0x4006AD: main (test4.c:12)
==12533== Address 0x51c8040 is 0 bytes inside a block of size 10 alloc'd
==12533== at 0x4A21958: malloc (vg_replace_malloc.c:270)
==12533== by 0x400679: main (test4.c:5)
==12533==
/*错误二:使用已经释放了的内存:第12行被释放掉的内存,在第13行被读写*/
==12533== Invalid write of size 1
==12533== at 0x4006B6: main (test4.c:13)
==12533== Address 0x51c8041 is 1 bytes inside a block of size 10 free'd
==12533== at 0x4A20F40: operator delete(void*) (vg_replace_malloc.c:480)
==12533== by 0x4006AD: main (test4.c:12)
==12533==
/*错误三:第12行被释放掉的内存,在第14行又一次被非法释放*/
==12533== Invalid free() / delete / delete[] / realloc()
==12533== at 0x4A2135A: free (vg_replace_malloc.c:446)
==12533== by 0x4006C1: main (test4.c:14)
==12533== Address 0x51c8040 is 0 bytes inside a block of size 10 free'd
==12533== at 0x4A20F40: operator delete(void*) (vg_replace_malloc.c:480)
==12533== by 0x4006AD: main (test4.c:12)
==12533==
==12533==
==12533== HEAP SUMMARY:
==12533== in use at exit: 0 bytes in 0 blocks
==12533== total heap usage: 1 allocs, 2 frees, 10 bytes allocated
==12533==
==12533== All heap blocks were freed -- no leaks are possible
==12533==
==12533== For counts of detected and suppressed errors, rerun with: -v
==12533== ERROR SUMMARY: 3 errors from 3 contexts (suppressed: 2 from 2)
错误一:申请和释放不对应
由于 C++ 兼容 C,而 C 与 C++ 的内存申请和释放函数是不同的,因此在 C++ 程序中,就有两套动态内存管理函数。一条不变的规则就是采用 C 方式申请的内存就用 C 方式释放;用 C++ 方式申请的内存,用 C++ 方式释放。也就是用 malloc/alloc/realloc 方式申请的内存,用 free 释放;用 new 方式申请的内存用 delete 释放;delete[]应该又只能和new[](分配数组)相对应。在上述程序中,用 malloc 方式申请了内存却用 delete 来释放,虽然这在很多情况下不会有问题,但这绝对是潜在的问题,不具备可移植性。
错误二:释放后仍然读写
本质上说,系统会在堆上维护一个动态内存链表,如果被释放,就意味着该块内存可以继续被分配给其他部分,如果内存被释放后再访问,就可能覆盖其他部分的信息,这是一种严重的错误,上述程序第13行中就在释放后仍然写这块内存。
错误三:申请和释放不匹配
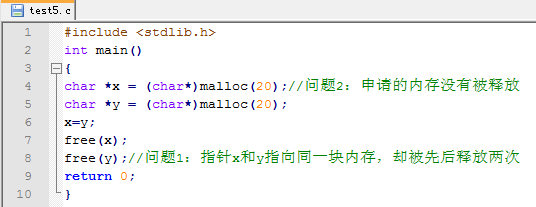
申请了多少内存,在使用完成后就要释放多少。如果没有释放,或者少释放了就是内存泄露;多释放了也会产生问题。上述程序中,指针p和pt指向的是同一块内存,却被先后释放两次。
8.4. 内存泄漏检测, 申请的空间是否释放
内存泄露(Memory leak)指的是,在程序中动态申请的内存,在使用完后既没有释放,又无法被程序的其他部分访问。内存泄露是在开发大型程序中最令人头疼的问题,以至于有人说,内存泄露是无法避免的。其实不然,防止内存泄露要从良好的编程习惯做起,另外重要的一点就是要加强单元测试(Unit Test),而memcheck就是这样一款优秀的工具。
在一个单独的函数中,每个人的内存泄露意识都是比较强的。但很多情况下,我们都会对malloc/free 或new/delete做 一些包装,以符合我们特定的需要,无法做到在一个函数中既使用又释放。内存泄露最容易发生的地方:即两个部分的 接口部分,一个函数申请内存,一个函数释放内存。并且这些函数由不同的人开发、使用,这样造成内存泄露的可能性就比较大了。这需要养成良好的单元测试习 惯,将内存泄露消灭在初始阶段。
Ø 使用Valgrind检查
valgrind --tool=memcheck --leak-check=full ./test5
Ø 分析输出的调试信息
==14849== Memcheck, a memory error detector
==14849== Copyright (C) 2002-2012, and GNU GPL'd, by Julian Seward et al.
==14849== Using Valgrind-3.8.1 and LibVEX; rerun with -h for copyright info
==14849== Command: ./test5
==14849==
/*错误一:第7行被释放掉的内存,在第8行又一次被非法释放*/
==14849== Invalid free() / delete / delete[] / realloc()
==14849== at 0x4A2135A: free (vg_replace_malloc.c:446)
==14849== by 0x400635: main (test5.c:8)
==14849== Address 0x51c80a0 is 0 bytes inside a block of size 20 free'd
==14849== at 0x4A2135A: free (vg_replace_malloc.c:446)
==14849== by 0x40062C: main (test5.c:7)
==14849==
==14849==
==14849== HEAP SUMMARY:
==14849== in use at exit: 20 bytes in 1 blocks
==14849== total heap usage: 2 allocs, 2 frees, 40 bytes allocated
==14849==
/*错误二:第4行申请的内存没有释放,malloc的就丢失了,因为没有指针指向它了,你想free也不知道free啥指针,所以是显示内存泄露*/
==14849== 20 bytes in 1 blocks are definitely lost in loss record 1 of 1
==14849== at 0x4A21958: malloc (vg_replace_malloc.c:270)
==14849== by 0x400609: main (test5.c:4)
==14849==
==14849== LEAK SUMMARY:
==14849== definitely lost: 20 bytes in 1 blocks
==14849== indirectly lost: 0 bytes in 0 blocks
==14849== possibly lost: 0 bytes in 0 blocks
==14849== still reachable: 0 bytes in 0 blocks
==14849== suppressed: 0 bytes in 0 blocks
==14849==
==14849== For counts of detected and suppressed errors, rerun with: -v
==14849== ERROR SUMMARY: 2 errors from 2 contexts (suppressed: 2 from 2)
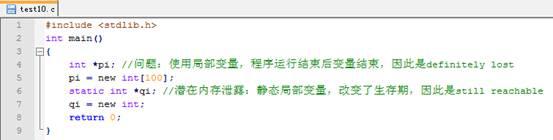
definitely lost和still reachable
Ø 使用Valgrind检查
valgrind --tool=memcheck --leak-check=full --show-reachable=yes ./test10
Ø 分析输出的调试信息
==2205== Memcheck, a memory error detector
==2205== Copyright (C) 2002-2012, and GNU GPL'd, by Julian Seward et al.
==2205== Using Valgrind-3.8.1 and LibVEX; rerun with -h for copyright info
==2205== Command: ./test10
==2205==
==2205==
==2205== HEAP SUMMARY:
==2205== in use at exit: 404 bytes in 2 blocks
==2205== total heap usage: 2 allocs, 0 frees, 404 bytes allocated
==2205==
/*潜在的内存泄露:第7行申请的内存没有释放,程序运行结束后仍然有qi指针指向它,因而内存指针还有机会使用或者释放,如果后面的程序不用或者不释放也会泄漏 */
==2205== 4 bytes in 1 blocks are still reachable in loss record 1 of 2
==2205== at 0x4A2278F: operator new(unsigned long) (vg_replace_malloc.c:298)
==2205== by 0x400637: main (test10.c:7)
==2205==
/*错误:第5行申请的内存没有释放,指针pi是局部变量,程序运行结束后pi就结束了,malloc的就丢失了,因为没有指针指向它了,所以是显示内存泄露*/
==2205== 400 bytes in 1 blocks are definitely lost in loss record 2 of 2
==2205== at 0x4A22302: operator new[](unsigned long) (vg_replace_malloc.c:363)
==2205== by 0x400629: main (test10.c:5)
==2205==
==2205== LEAK SUMMARY:
==2205== definitely lost: 400 bytes in 1 blocks
==2205== indirectly lost: 0 bytes in 0 blocks
==2205== possibly lost: 0 bytes in 0 blocks
==2205== still reachable: 4 bytes in 1 blocks
==2205== suppressed: 0 bytes in 0 blocks
==2205==
==2205== For counts of detected and suppressed errors, rerun with: -v
==2205== ERROR SUMMARY: 1 errors from 1 contexts (suppressed: 2 from 2)

Ø 使用Valgrind检查
valgrind --tool=memcheck --leak-check=full ./test2
Ø 分析输出的调试信息
==30925== Memcheck, a memory error detector
==30925== Copyright (C) 2002-2012, and GNU GPL'd, by Julian Seward et al.
==30925== Using Valgrind-3.8.1 and LibVEX; rerun with -h for copyright info
==30925== Command: ./test2
==30925==
/*错误一:数组越界,位置:第5行*/
==30925== Invalid write of size 4
==30925== at 0x400516: f (test2.c:5)
==30925== by 0x400526: main (test2.c:10)
==30925== Address 0x4d68068 is 0 bytes after a block of size 40 alloc'd
==30925== at 0x4A21958: malloc (vg_replace_malloc.c:270)
==30925== by 0x400509: f (test2.c:4)
==30925== by 0x400526: main (test2.c:10)
==30925==
==30925==
==30925== HEAP SUMMARY:
==30925== in use at exit: 40 bytes in 1 blocks
==30925== total heap usage: 1 allocs, 0 frees, 40 bytes allocated
==30925==
/*错误二:第4行申请的内存没有释放,指针x是局部变量,f函数调用结束后x就结束了,malloc的就丢失了,因为没有指针指向它了,所以是显示内存泄露*/
==30925== 40 bytes in 1 blocks are definitely lost in loss record 1 of 1
==30925== at 0x4A21958: malloc (vg_replace_malloc.c:270)
==30925== by 0x400509: f (test2.c:4)
==30925== by 0x400526: main (test2.c:10)
==30925==
==30925== LEAK SUMMARY:
==30925== definitely lost: 40 bytes in 1 blocks
==30925== indirectly lost: 0 bytes in 0 blocks
==30925== possibly lost: 0 bytes in 0 blocks
==30925== still reachable: 0 bytes in 0 blocks
==30925== suppressed: 0 bytes in 0 blocks
==30925==
==30925== For counts of detected and suppressed errors, rerun with: -v
==30925== ERROR SUMMARY: 2 errors from 2 contexts (suppressed: 2 from 2)
8.5. 非法释放内存
申请了多少内存,在使用完成后就要释放多少。如果没有释放,或者少释放了就是内存泄露;多释放了也会产生问题。

Ø 使用Valgrind检查
valgrind --tool=memcheck --leak-check=full ./test7
Ø 分析输出的调试信息
==21443== Memcheck, a memory error detector
==21443== Copyright (C) 2002-2012, and GNU GPL'd, by Julian Seward et al.
==21443== Using Valgrind-3.8.1 and LibVEX; rerun with -h for copyright info
==21443== Command: ./test7
==21443==
/*错误:第5行被释放掉的内存,在第6行又一次被非法释放*/
==21443== Invalid free() / delete / delete[] / realloc()
==21443== at 0x4A2135A: free (vg_replace_malloc.c:446)
==21443== by 0x40056F: main (test7.c:6)
==21443== Address 0x4d68040 is 0 bytes inside a block of size 10 free'd
==21443== at 0x4A2135A: free (vg_replace_malloc.c:446)
==21443== by 0x400566: main (test7.c:5)
==21443==
==21443==
==21443== HEAP SUMMARY:
==21443== in use at exit: 0 bytes in 0 blocks
==21443== total heap usage: 1 allocs, 2 frees, 10 bytes allocated
==21443==
==21443== All heap blocks were freed -- no leaks are possible
==21443==
==21443== For counts of detected and suppressed errors, rerun with: -v
==21443== ERROR SUMMARY: 1 errors from 1 contexts (suppressed: 2 from 2)
8.6. 传递系统调用参数时读写权限不足
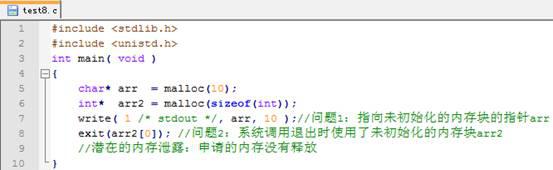
Ø 使用Valgrind检查
valgrind --tool=memcheck --leak-check=full --show-reachable=yes --track-origins=yes ./test8
Ø 分析输出的调试信息
==23378== Memcheck, a memory error detector
==23378== Copyright (C) 2002-2012, and GNU GPL'd, by Julian Seward et al.
==23378== Using Valgrind-3.8.1 and LibVEX; rerun with -h for copyright info
==23378== Command: ./test8
==23378==
/*错误一:第7行指向未初始化的内存块的指针*/
==23378== Syscall param write(buf) points to uninitialised byte(s)
==23378== at 0x4BDB790: __write_nocancel (in /lib64/libc-2.4.so)
==23378== by 0x4005CE: main (test8.c:7)
==23378== Address 0x4d68040 is 0 bytes inside a block of size 10 alloc'd
==23378== at 0x4A21958: malloc (vg_replace_malloc.c:270)
==23378== by 0x4005A9: main (test8.c:5)
==23378== Uninitialised value was created by a heap allocation
==23378== at 0x4A21958: malloc (vg_replace_malloc.c:270)
==23378== by 0x4005A9: main (test8.c:5)
==23378==
/*错误二:第8行系统调用退出时使用了未初始化的内存块*/
==23378== Syscall param exit_group(status) contains uninitialised byte(s)
==23378== at 0x4BBA888: _Exit (in /lib64/libc-2.4.so)
==23378== by 0x4B5A6F4: exit (in /lib64/libc-2.4.so)
==23378== by 0x4005D9: main (test8.c:8)
==23378== Uninitialised value was created by a heap allocation
==23378== at 0x4A21958: malloc (vg_replace_malloc.c:270)
==23378== by 0x4005B7: main (test8.c:6)
==23378==
==23378==
==23378== HEAP SUMMARY:
==23378== in use at exit: 14 bytes in 2 blocks
==23378== total heap usage: 2 allocs, 0 frees, 14 bytes allocated
==23378==
/*潜在的内存泄露:第6行申请的内存没有释放*/
==23378== 4 bytes in 1 blocks are still reachable in loss record 1 of 2
==23378== at 0x4A21958: malloc (vg_replace_malloc.c:270)
==23378== by 0x4005B7: main (test8.c:6)
==23378==
/*潜在的内存泄露:第5行申请的内存没有释放*/
==23378== 10 bytes in 1 blocks are still reachable in loss record 2 of 2
==23378== at 0x4A21958: malloc (vg_replace_malloc.c:270)
==23378== by 0x4005A9: main (test8.c:5)
==23378==
==23378== LEAK SUMMARY:
==23378== definitely lost: 0 bytes in 0 blocks
==23378== indirectly lost: 0 bytes in 0 blocks
==23378== possibly lost: 0 bytes in 0 blocks
==23378== still reachable: 14 bytes in 2 blocks
==23378== suppressed: 0 bytes in 0 blocks
==23378==
==23378== For counts of detected and suppressed errors, rerun with: -v
==23378== ERROR SUMMARY: 2 errors from 2 contexts (suppressed: 2 from 2)
8.7. 使用不恰当的释放函数释放块
由于 C++ 兼容 C,而 C 与 C++ 的内存申请和释放函数是不同的,因此在 C++ 程序中,就有两套动态内存管理函数。一条不变的规则就是采用 C 方式申请的内存就用 C 方式释放;用 C++ 方式申请的内存,用 C++ 方式释放。也就是用 malloc/alloc/realloc 方式申请的内存,用 free 释放;用 new 方式申请的内存用 delete 释放。在上述程序中,用 malloc 方式申请了内存却用 delete 来释放,虽然这在很多情况下不会有问题,但这绝对是潜在的问题。
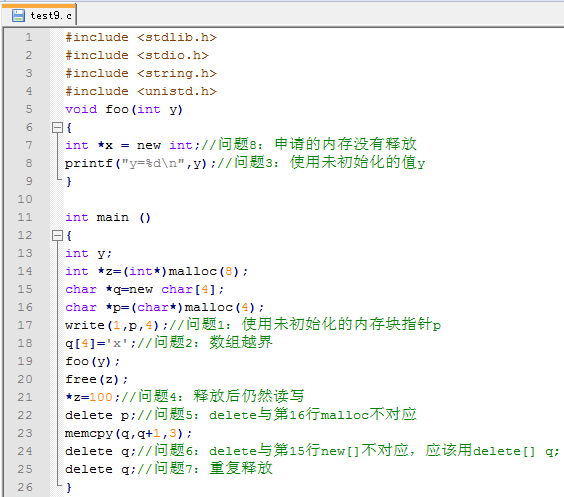
Ø 使用Valgrind检查
valgrind --tool=memcheck --leak-check=full --show-reachable=yes ./test9
Ø 分析输出的调试信息
==18190== Memcheck, a memory error detector
==18190== Copyright (C) 2002-2012, and GNU GPL'd, by Julian Seward et al.
==18190== Using Valgrind-3.8.1 and LibVEX; rerun with -h for copyright info
==18190== Command: ./test9
==18190==
/*错误一:第17行使用未初始化的内存块指针p*/
==18190== Syscall param write(buf) points to uninitialised byte(s)
==18190== at 0x503B790: __write_nocancel (in /lib64/libc-2.4.so)
==18190== by 0x40080A: main (test9.c:17)
==18190== Address 0x51c80e0 is 0 bytes inside a block of size 4 alloc'd
==18190== at 0x4A21958: malloc (vg_replace_malloc.c:270)
==18190== by 0x4007F3: main (test9.c:16)
==18190==
/*错误二:第18行数组越界*/
==18190== Invalid write of size 1
==18190== at 0x400813: main (test9.c:18)
==18190== Address 0x51c8094 is 0 bytes after a block of size 4 alloc'd
==18190== at 0x4A22302: operator new[](unsigned long) (vg_replace_malloc.c:363)
==18190== by 0x4007E5: main (test9.c:15)
==18190==
/*错误三:第8行使用未初始化的值y,在main()调用的foo ()函数中*/
==18190== Use of uninitialised value of size 8
==18190== at 0x4FC83CD: _itoa_word (in /lib64/libc-2.4.so)
==18190== by 0x4FCB507: vfprintf (in /lib64/libc-2.4.so)
==18190== by 0x4FD2509: printf (in /lib64/libc-2.4.so)
==18190== by 0x4007C2: foo(int) (test9.c:8)
==18190== by 0x40081D: main (test9.c:19)
==18190==
/*第8行使用未初始化的值y,在main()调用的foo ()函数中,这里的函数调用关系是通过堆栈跟踪的,所以有时会非常多,其它一些错误都是由于把未初始化的值传递给libc函数而被检测到*/
==18190== Conditional jump or move depends on uninitialised value(s)
==18190== at 0x4FC83D7: _itoa_word (in /lib64/libc-2.4.so)
==18190== by 0x4FCB507: vfprintf (in /lib64/libc-2.4.so)
==18190== by 0x4FD2509: printf (in /lib64/libc-2.4.so)
==18190== by 0x4007C2: foo(int) (test9.c:8)
==18190== by 0x40081D: main (test9.c:19)
==18190==
==18190== Conditional jump or move depends on uninitialised value(s)
==18190== at 0x4FCB576: vfprintf (in /lib64/libc-2.4.so)
==18190== by 0x4FD2509: printf (in /lib64/libc-2.4.so)
==18190== by 0x4007C2: foo(int) (test9.c:8)
==18190== by 0x40081D: main (test9.c:19)
==18190==
==18190== Conditional jump or move depends on uninitialised value(s)
==18190== at 0x4FCBAE1: vfprintf (in /lib64/libc-2.4.so)
==18190== by 0x4FD2509: printf (in /lib64/libc-2.4.so)
==18190== by 0x4007C2: foo(int) (test9.c:8)
==18190== by 0x40081D: main (test9.c:19)
==18190==
==18190== Conditional jump or move depends on uninitialised value(s)
==18190== at 0x4FCA5F2: vfprintf (in /lib64/libc-2.4.so)
==18190== by 0x4FD2509: printf (in /lib64/libc-2.4.so)
==18190== by 0x4007C2: foo(int) (test9.c:8)
==18190== by 0x40081D: main (test9.c:19)
==18190==
y=0
/*错误四:第21行释放后的内存仍然被读写*/
==18190== Invalid write of size 4
==18190== at 0x40082B: main (test9.c:21)
==18190== Address 0x51c8040 is 0 bytes inside a block of size 8 free'd
==18190== at 0x4A2135A: free (vg_replace_malloc.c:446)
==18190== by 0x400826: main (test9.c:20)
==18190==
/*错误五:第22行delete与第16行malloc不对应*/
==18190== Mismatched free() / delete / delete []
==18190== at 0x4A20F40: operator delete(void*) (vg_replace_malloc.c:480)
==18190== by 0x400839: main (test9.c:22)
==18190== Address 0x51c80e0 is 0 bytes inside a block of size 4 alloc'd
==18190== at 0x4A21958: malloc (vg_replace_malloc.c:270)
==18190== by 0x4007F3: main (test9.c:16)
==18190==
/*错误六:第24行delete与第15行new[]不对应*/
==18190== Mismatched free() / delete / delete []
==18190== at 0x4A20F40: operator delete(void*) (vg_replace_malloc.c:480)
==18190== by 0x40085B: main (test9.c:24)
==18190== Address 0x51c8090 is 0 bytes inside a block of size 4 alloc'd
==18190== at 0x4A22302: operator new[](unsigned long) (vg_replace_malloc.c:363)
==18190== by 0x4007E5: main (test9.c:15)
==18190==
/*错误七:第24行释放了的内存,在第25行重复释放*/
==18190== Invalid free() / delete / delete[] / realloc()
==18190== at 0x4A20F40: operator delete(void*) (vg_replace_malloc.c:480)
==18190== by 0x400864: main (test9.c:25)
==18190== Address 0x51c8090 is 0 bytes inside a block of size 4 free'd
==18190== at 0x4A20F40: operator delete(void*) (vg_replace_malloc.c:480)
==18190== by 0x40085B: main (test9.c:24)
==18190==
==18190==
==18190== HEAP SUMMARY:
==18190== in use at exit: 4 bytes in 1 blocks
==18190== total heap usage: 4 allocs, 4 frees, 20 bytes allocated
==18190==
/*错误八:foo函数第7行申请的内存没有释放*/
==18190== 4 bytes in 1 blocks are definitely lost in loss record 1 of 1
==18190== at 0x4A2278F: operator new(unsigned long) (vg_replace_malloc.c:298)
==18190== by 0x4007AC: foo(int) (test9.c:7)
==18190== by 0x40081D: main (test9.c:19)
==18190==
==18190== LEAK SUMMARY:
==18190== definitely lost: 4 bytes in 1 blocks
==18190== indirectly lost: 0 bytes in 0 blocks
==18190== possibly lost: 0 bytes in 0 blocks
==18190== still reachable: 0 bytes in 0 blocks
==18190== suppressed: 0 bytes in 0 blocks
==18190==
==18190== For counts of detected and suppressed errors, rerun with: -v
==18190== Use --track-origins=yes to see where uninitialised values come from
==18190== ERROR SUMMARY: 12 errors from 12 contexts (suppressed: 2 from 2)
8.8. 非法指针
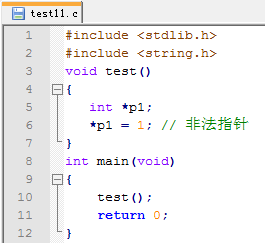
Ø 使用Valgrind检查
valgrind --tool=memcheck --leak-check=full --show-reachable=yes --track-origins=yes ./test11
Ø 分析输出的调试信息
==1051== Memcheck, a memory error detector
==1051== Copyright (C) 2002-2012, and GNU GPL'd, by Julian Seward et al.
==1051== Using Valgrind-3.8.1 and LibVEX; rerun with -h for copyright info
==1051== Command: ./test11
==1051==
==1051== Use of uninitialised value of size 8
==1051== at 0x4004C0: test (test11.c:6)
==1051== by 0x4004D5: main (test11.c:10)
==1051== Uninitialised value was created by a stack allocation
==1051== at 0x4004B8: test (test11.c:4)
==1051==
==1051== Invalid write of size 4
==1051== at 0x4004C0: test (test11.c:6)
==1051== by 0x4004D5: main (test11.c:10)
==1051== Address 0x0 is not stack'd, malloc'd or (recently) free'd
==1051==
==1051==
/*错误:第6行非法指针,导致coredump*/
==1051== Process terminating with default action of signal 11 (SIGSEGV)
==1051== Access not within mapped region at address 0x0
==1051== at 0x4004C0: test (test11.c:6)
==1051== by 0x4004D5: main (test11.c:10)
==1051== If you believe this happened as a result of a stack
==1051== overflow in your program's main thread (unlikely but
==1051== possible), you can try to increase the size of the
==1051== main thread stack using the --main-stacksize= flag.
==1051== The main thread stack size used in this run was 8388608.
==1051==
==1051== HEAP SUMMARY:
==1051== in use at exit: 0 bytes in 0 blocks
==1051== total heap usage: 0 allocs, 0 frees, 0 bytes allocated
==1051==
==1051== All heap blocks were freed -- no leaks are possible
==1051==
==1051== For counts of detected and suppressed errors, rerun with: -v
==1051== ERROR SUMMARY: 2 errors from 2 contexts (suppressed: 2 from 2)
8.9. 读写不适当的栈中内存
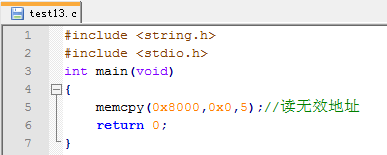
Ø 使用Valgrind检查
valgrind --leak-check=full --show-reachable=yes ./test13
Ø 分析输出的调试信息
==13683== Memcheck, a memory error detector
==13683== Copyright (C) 2002-2012, and GNU GPL'd, by Julian Seward et al.
==13683== Using Valgrind-3.8.1 and LibVEX; rerun with -h for copyright info
==13683== Command: ./test13
==13683==
/*错误:第5行地址处根本没有映射内存页面,故为指向无效地址*/
==13683== Invalid read of size 4
==13683== at 0x4004BC: main (test13.c:5)
==13683== Address 0x0 is not stack'd, malloc'd or (recently) free'd
==13683==
==13683==
==13683== Process terminating with default action of signal 11 (SIGSEGV)
==13683== Access not within mapped region at address 0x0
==13683== at 0x4004BC: main (test13.c:5)
==13683== If you believe this happened as a result of a stack
==13683== overflow in your program's main thread (unlikely but
==13683== possible), you can try to increase the size of the
==13683== main thread stack using the --main-stacksize= flag.
==13683== The main thread stack size used in this run was 8388608.
==13683==
==13683== HEAP SUMMARY:
==13683== in use at exit: 0 bytes in 0 blocks
==13683== total heap usage: 0 allocs, 0 frees, 0 bytes allocated
==13683==
==13683== All heap blocks were freed -- no leaks are possible
==13683==
==13683== For counts of detected and suppressed errors, rerun with: -v
==13683== ERROR SUMMARY: 1 errors from 1 contexts (suppressed: 2 from 2)
9、 Callgrind使用举例
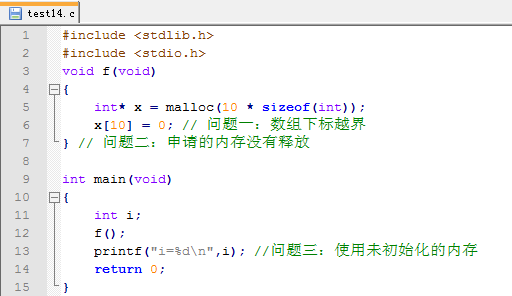
Ø 使用Valgrind检查
valgrind --tool=callgrind ./test14
Ø 分析输出的调试信息
==6350== Callgrind, a call-graph generating cache profiler
==6350== Copyright (C) 2002-2012, and GNU GPL'd, by Josef Weidendorfer et al.
==6350== Using Valgrind-3.8.1 and LibVEX; rerun with -h for copyright info
==6350== Command: ./test14
==6350==
==6350== For interactive control, run 'callgrind_control -h'.
i=0
==6350==
==6350== Events : Ir
==6350== Collected : 148566
==6350==
==6350== I refs: 148,566
/data/jeannedai> callgrind_annotate callgrind.out.6350
--------------------------------------------------------------------------------
Profile data file 'callgrind.out.6350' (creator: callgrind-3.8.1)
--------------------------------------------------------------------------------
I1 cache:
D1 cache:
LL cache:
Timerange: Basic block 0 - 30496
Trigger: Program termination
Profiled target: ./test14 (PID 6350, part 1)
Events recorded: Ir
Events shown: Ir
Event sort order: Ir
Thresholds: 99
Include dirs:
User annotated:
Auto-annotation: off
--------------------------------------------------------------------------------
Ir
--------------------------------------------------------------------------------
148,566 PROGRAM TOTALS
--------------------------------------------------------------------------------
Ir file:function
--------------------------------------------------------------------------------
40,690 ???:_dl_addr [/lib64/libc-2.4.so]
25,259 ???:do_lookup_x [/lib64/ld-2.4.so]
21,856 ???:_dl_relocate_object [/lib64/ld-2.4.so]
17,011 ???:strcmp [/lib64/ld-2.4.so]
13,135 ???:_dl_elf_hash [/lib64/ld-2.4.so]
8,130 ???:_dl_lookup_symbol_x [/lib64/ld-2.4.so]
1,634 ???:_dl_map_object_from_fd [/lib64/ld-2.4.so]
1,095 ???:_dl_map_object_deps [/lib64/ld-2.4.so]
1,046 ???:strsep [/lib64/ld-2.4.so]
1,042 ???:dl_main [/lib64/ld-2.4.so]
1,025 ???:malloc_init_state [/lib64/libc-2.4.so]
895 ???:_dl_check_map_versions [/lib64/ld-2.4.so]
823 ???:_dl_name_match_p [/lib64/ld-2.4.so]
799 ???:strlen [/lib64/ld-2.4.so]
10、 Valgrind不能查出哪些错误
Valgrind不对静态数组(分配在栈上)进行边界检查。如果在程序中声明了一个数组:

==24729== Memcheck, a memory error detector
==24729== Copyright (C) 2002-2012, and GNU GPL'd, by Julian Seward et al.
==24729== Using Valgrind-3.8.1 and LibVEX; rerun with -h for copyright info
==24729== Command: ./test12
==24729==
==24729==
==24729== HEAP SUMMARY:
==24729== in use at exit: 0 bytes in 0 blocks
==24729== total heap usage: 0 allocs, 0 frees, 0 bytes allocated
==24729==
==24729== All heap blocks were freed -- no leaks are possible
==24729==
==24729== For counts of detected and suppressed errors, rerun with: -v
==24729== ERROR SUMMARY: 0 errors from 0 contexts (suppressed: 2 from 2)
Valgrind则不会警告你!出于测试目的,你可以把数组改为动态在堆上分配的数组,这样就可能进行边界检查了。这个方法好像有点得不偿失的感觉。